
Спектрометр-анализатор спектра HP350F
- Категория: Spectrometers >>>
- Поставщик: Dongguan,NAPUI,Electronic,Technology,Co.,Ltd.
Поделиться:
Описание и отзывы
Трекер стоимости
| Месяц | Минимальная цена | Макс. стоимость |
|---|---|---|
| Sep-18-2025 | 0.46 $* | 0.57 $* |
| Aug-18-2025 | 0.48 $* | 0.98 $* |
| Jul-18-2025 | 0.11 $* | 0.9 $* |
| Jun-18-2025 | 0.77 $* | 0.19 $* |
| May-18-2025 | 0.96 $* | 0.19 $* |
| Apr-18-2025 | 0.11 $* | 0.65 $* |
| Mar-18-2025 | 0.53 $* | 0.31 $* |
| Feb-18-2025 | 0.25 $* | 0.12 $* |
| Jan-18-2025 | 0.12 $* | 0.95 $* |
Характеристики
HP350F 380-780nm Light Flicker Tester Spectrometer Spectrum Graph Analyzer
HP350F strobe spectrum analyzer is a new generation of light source light color test instrument, 5 inch IPS touch screen, using advanced micro spectrometer, embedded operating system and microcomputer technology integration, convenient field testing, making the test more convenient and simple, more in line with the parameter test analysis and verification of field application scenarios.
Main applications:
(1) (According to the standard:
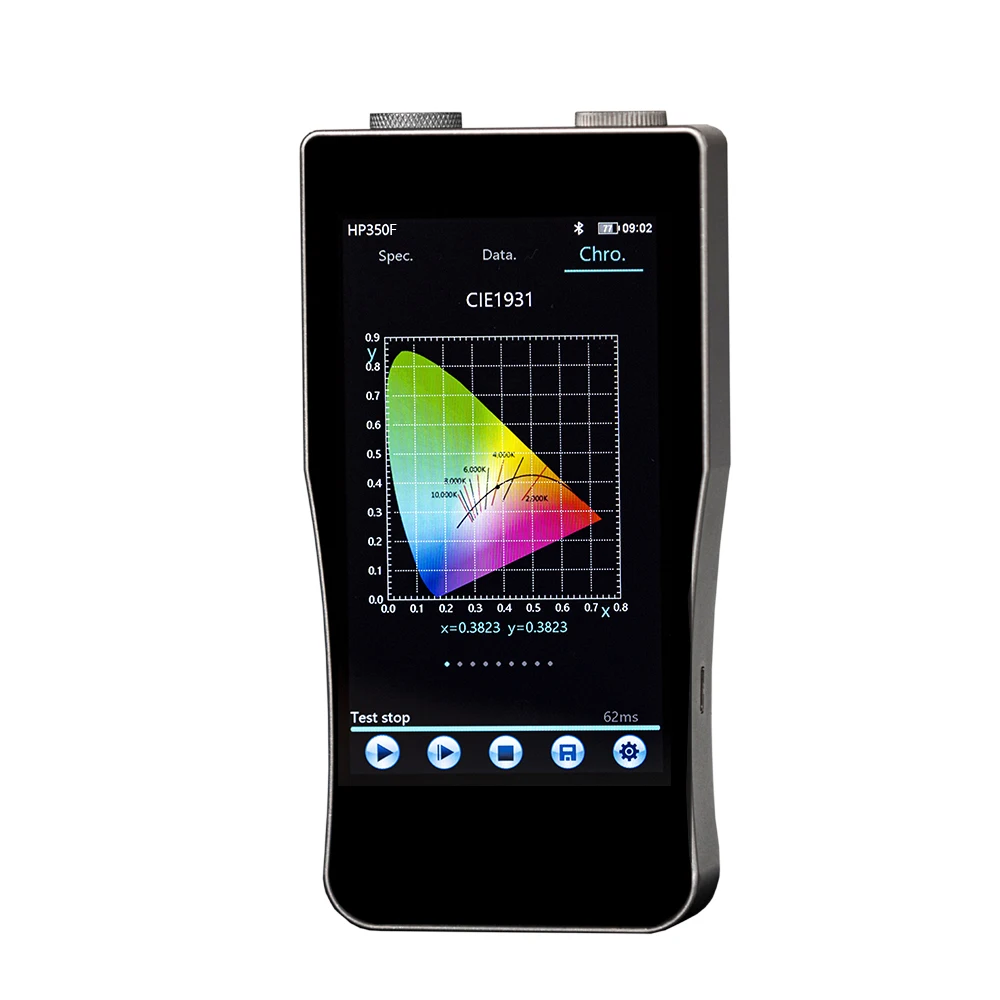
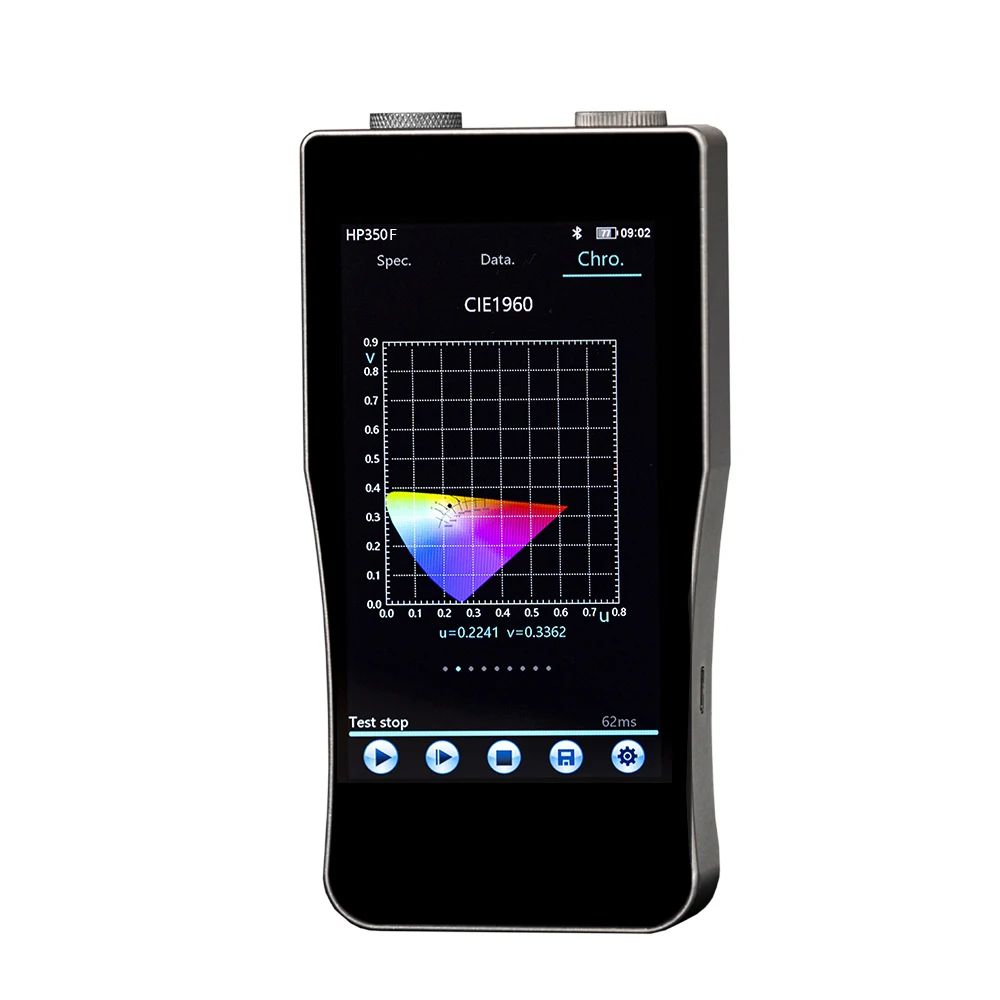
Lighting: GB55016-2021 architectural lighting CIE1931, CIE1960, CIE1976, GB/T5700-2008, GB/T 36979
Strobe: basic measurement, IEEE PAR 1789 "IEEE Std 1789TM-2015" GB/T 18910.61
(2) Basic measurement functions:
Color coordinates (x, y, u, v, u', v') wavelength, color temperature (CCT), illuminance (lx), color rendering index (Ra, Ravg), color tolerance (SDCM), color purity (Purity), color saturation (Rg), color fidelity (Rf), color quality index (CQS), light and dark ratio (S/P), transmittance, flicker index, flicker percentage, modulation depth, strobe risk level, etc
(1) Product advantages
1. Communication mode: USB
2. A variety of display methods: computer, IPS touch screen
3. The shape is in line with the ergonomic handheld design, which is convenient and convenient to use.
(2) Core devices
1. TCD1304DG CCD detector is coated with anti-reflection coating to achieve quantum efficiency curve in the illumination region with a band range of 380-780nm
2. Enhanced coating grating: number of lines: 1200 lines, shining wavelength 300nm, spectral response 200-1100nm
3. Enhance collimator and focusing mirror
4. 16-bit high-speed AD sampling
5. High-precision stable operation circuit
6. High-precision optical path, small stray light, elimination of high-order diffraction spectrum (with cloud spectrum filter system)
(3) Test advantages
1. Comparison test, transmittance test, parameter comparison (two modes: rocking and locking)
2. Timing test, timed storage (light attenuation test verification can be carried out)
3. Adjustable wavelength, convenient query (single band is more convenient to view and analyze)
4. APP, mini program one-click test one-click sharing (moments, Weibo, forums, etc.)
5. Test result correction (test result coefficient correction for different scenarios and environmental changes)
Characteristic: optical path characteristics (fiber spectrometer structure)
1. A variety of optical inputs: cosine correction probe, SM905 optical fiber (with cosine correction)
2. Wavelength range: 380-780nm
3. Spectral resolution: ±0.2nm, wavelength resolution:
4. Photometric linearity± 0.3%
5. Stray light: <0.1%
6. Cosine correction of photometric probe: error ≤5%, nonlinear ≤1%
7. Absolute value of fatigue error: ≤2%
9. Relative indication error: ±5%
10. Zero value error: ±1% (FS)
11. Range: automatic error ±1%
12. High-speed data acquisition, integration time: milliseconds
13. Focal length 42.5mm symmetrical non-cross H-T optical path
14. Communication mode: USB communication
15. Dimensions: 186mm*80mm*21.8
16. Using advanced micro-spectrometer technology, higher test accuracy than traditional probes;
17. Can be connected to computer software test, can be connected to computer to print test report;
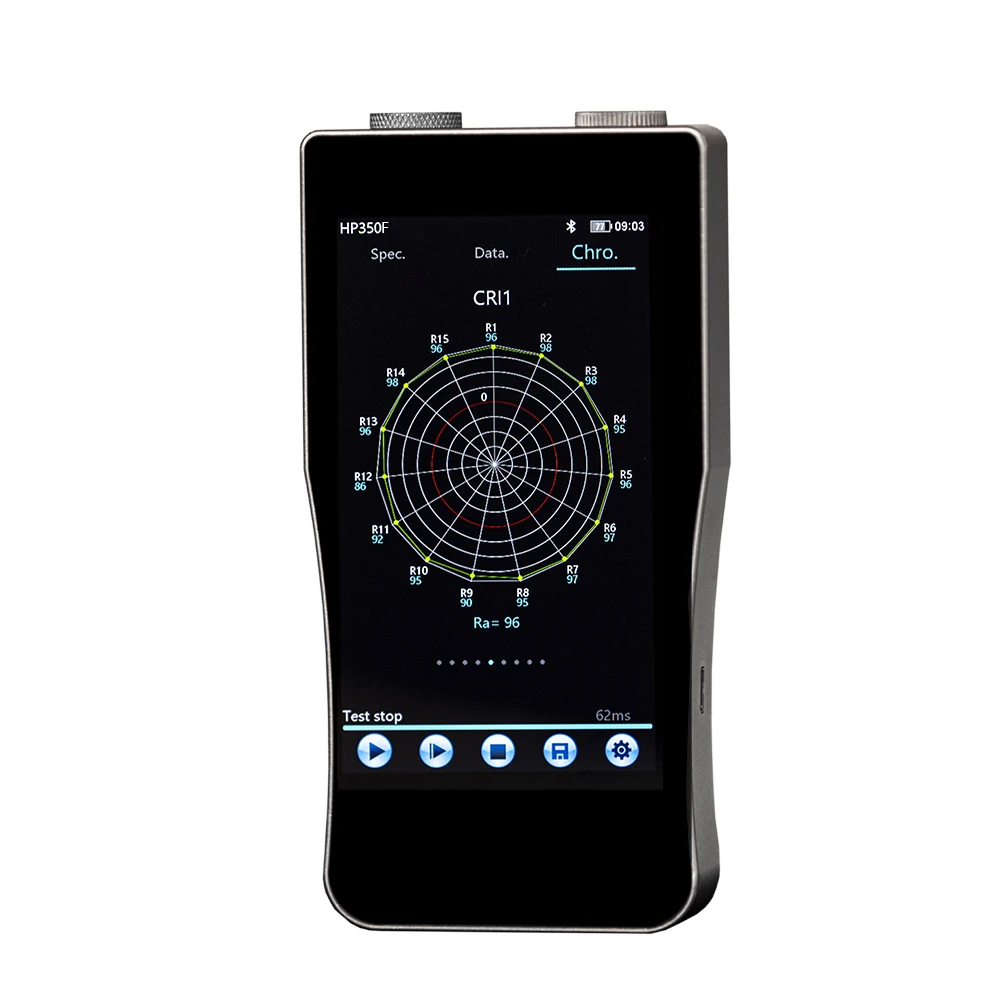
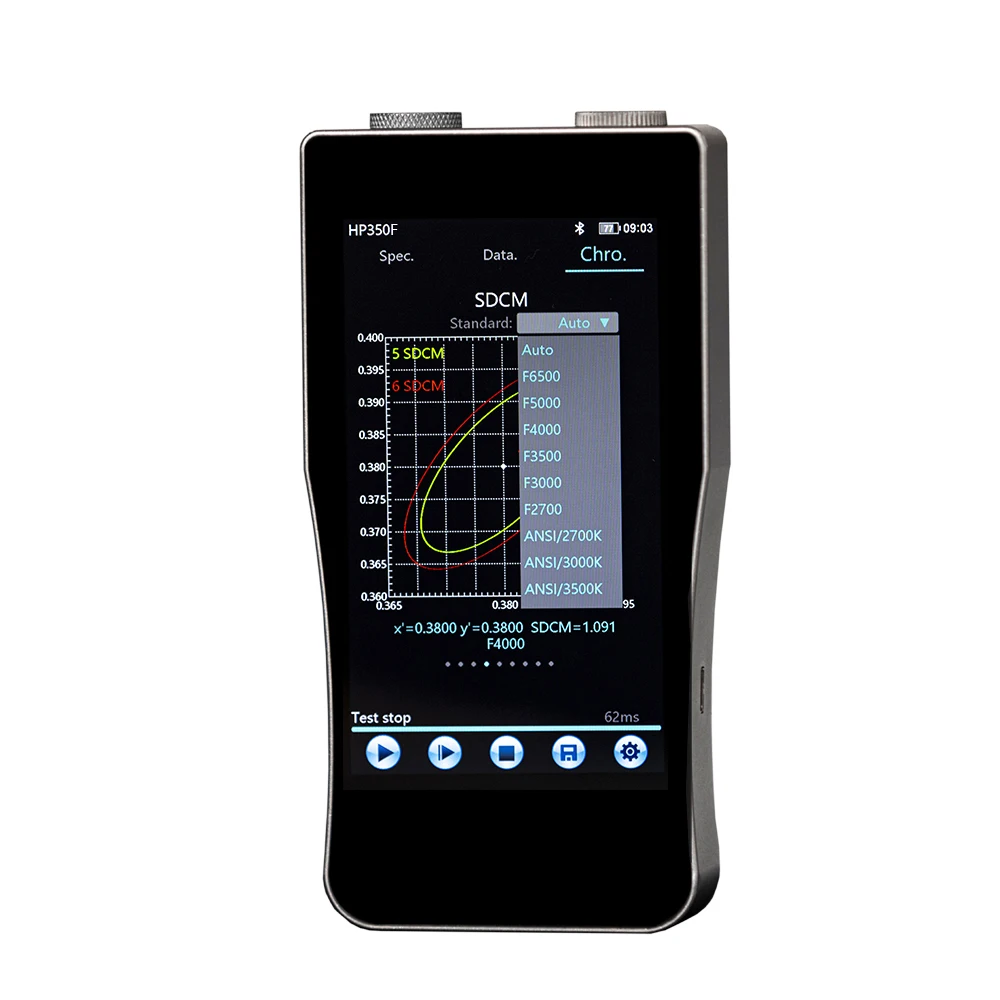
18. Color liquid crystal display, good graphic interface, can display spectral waveform, color tolerance ellipse diagram;
19. 5 inch IPS touch screen
Test parameters:
ColorTemperature | Color quality index |
Illuminance | Color gamut index |
Irradiance | fidelity |
Coordinates 1931 | |
Coordinates 1960 | CIE1931 CIE1960 CIE1976 |
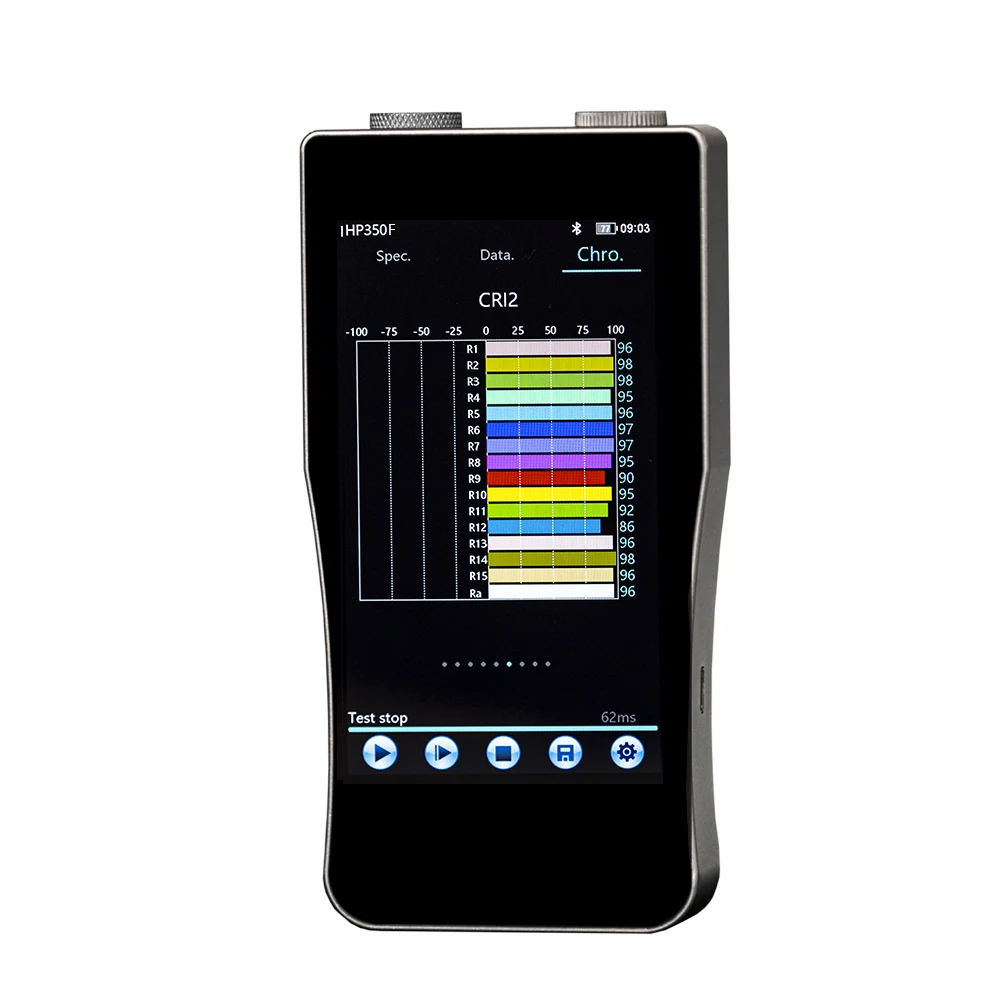
Coordinates 1976 | Color rendering index Ra |
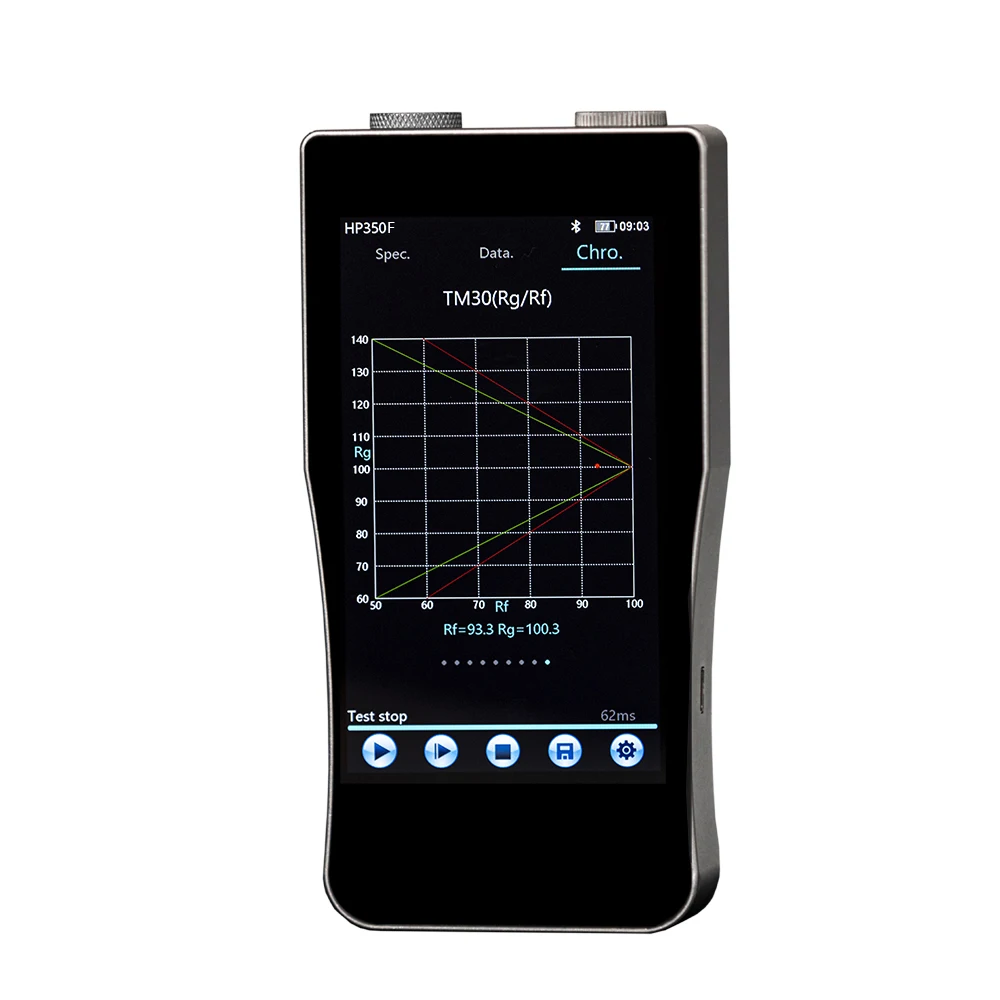
Color RenderingIndex | TM-30 fidelity distribution map |
Color RenderingIndex | Transmittance |
Relative Spectral Power Distribution | Sample time |
Color Tolerance | Volatility depth |
Peak Wavelength | Flicker percentage |
Dominant Wavelength | Flicker index |
Centre Wavelength | Frequency (Hz) |
Centroid Wavelength | Strobe depth |
Half Width | Modulation Depth (MD) |
Color Purity | maximum |
Color Deviation | minimum |
LightDarkVisualRatio | average value |
Candela () | |
Red Ratio | |
Green Ratio | |
Blue Ratio | |
CIE1931 RGB Stimulus Value X,Y,Z |
Technical characteristics
Model and name | HP350F strobe spectroscopic analysis |
Wavelength range | 380nm~780nm |
Spectroscopic mode | Telephoto crossover asymmetric CT spectroscopic system |
sensor | High precision CCD |
Spectral bandwidth (FWHM) | 2nm |
Spectral resolution | 0.2nm |
x,y coordinate values | x,y accuracy ±0.0015 ; x, y repeatability ± 0.0005 |
Wavelength accuracy | ±0.5nm |
Wavelength data output interval | 1nm |
Illuminance accuracy | Level 1 (±4% of readings ± 1 reading) |
Color rendering accuracy | ±1.5% |
Photosensitive surface | 10mm |
Screen type | 5 inch HD IPS capacitive touch screen |
Color coordinate accuracy | ±0.0025 (better stable than standard light source ±0.0005 traceable to NIM) |
Color temperature range | 1,000K~100,000K |
Stray light | ≤0.3% |
Illuminance measurement range | 0.1~500Klx |
Measurement mode | Single test/continuous test |
Language mode | Chinese and English can be switched |
Spectral display mode | Spectral distribution map |
Data display patterns | All parameters can be displayed by sliding up and down |
Graphical display mode | CIE1931 chromaticity diagram CIE1960 chromaticity diagram CIE1976 chromaticity diagram Color tolerance ellipse diagram Color rendering index round chart Color rendering index histogram TM-30 fidelity distribution diagram TM-30 chromaticity change distribution diagram TM-30 (Rg/Rf) fluctuation chart, spectrogram, hazard level diagram |
Integration time | 5µs~10000ms |
File save format | SOURCE FILES/PDF/EXCEL, ETC |
Communication interface | Type-C interface |
Use temperature/humidity range | (-10~40)°C, relative humidity<70% (non-condensing) |
Storage temperature/humidity range | (-20~45)°C, relative humidity<70% (non-condensing) |
School zero way | Automatic zeroing |
Screen size | 5.0" IPS HD LCD touch screen |
Storage capacity | 8G comes standard with the factory |
Power supply mode | Built-in lithium battery/power adapter |


Company Information


Похожие товары


Флуоресцентный спектрофотометр F96Pro
US $4339-$4539

Спектрофотометр, цветной лабораторный спектрофотометр, цена
US $200.00-$400.00


Высокоточный портативный спектрометр видимый спектрофотометр
US $243.00-$350.00